22 volume patterns in technical analysis, this is the best when analyzing trading volume, in forex investing.
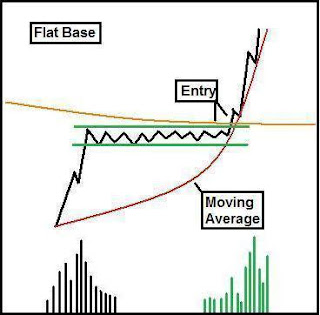
1. The price increases after the sideways process, confirmed by the increase in trading volume. This pattern closely resembles the "cup and handle" pattern, or the "flag" pattern. This pattern has two important points: Sideway breakout, and increased breakout volume (entry point). The moving average is just a signal for further reference, it is not decisive in this model.
2. Price moves according to the principle: Price up + Volume up = Price goes up. Price up + volume down = Price goes down. And vice versa with the price down (see more article: https://www.caphile.com/2022/11/the-role-of-volume-in-technical-analysis.html)
3. This pattern shows the price making new higher highs (A, B, C), but decreasing volume, so there is a sign of a downward price reversal.
Read more: How to use metatrader4
4. After the uptrend turns into a downtrend, the price increases but volume decreases, confirming a downtrend. In addition, this price zone forms a very perfect head and shoulders pattern.
5. Similar to pattern #4, price falls and volume increases, confirming a strong downtrend.
6. Rising price establishes a top zone, and trading volume increases accordingly.
7. The trading volume reaches the maximum, the price goes to the lowest, then the breakout reverses upward.
8. At the price reversal area, 2 bottoms were formed, bottom 1 has large volume, bottom 2 has small volume. This is a very reliable double bottom pattern.
9. This is a common reversal pattern. Price breaks out of the trendline, accompanied by increased trading volume.
10. This pattern gives a signal to absorb volume at the top, then the price reverses downwards.
11. Contrast with model number 10.
12. This pattern has 2 possibilities: Continue uptrend, or will downtrend. This period of reduced volume is known as the "rest period".
13. Price reverses when volume declines, meaning selling pressure decreases. Notice at the breakout point, volume increases.
14. It is a false reversal, because trading volume is low, no reversal occurs.
15. Contrast with model number 13.
16. Head and shoulders pattern, the most reliable in technical analysis.
17. Inverted head and shoulders pattern.
18. Double top pattern, note the target price range.
19. Double bottom pattern.
20. If you've read this far, you don't need to explain anymore, right?
21. Contrast with model number 20.
22. Model cup and handle, very reliable.
Best regards,


No comments:
Post a Comment