MetaTrader 4 (MT4) is a popular software that almost every trader uses to trade forex, gold, and other commodities.
Currently MT4 software is available on computers and phones, this article shares about how to use metatrader 4 on computer.
MetaTrader 4 software is free to download and install (very simple), after installation is complete, the basic operations include:
- DISPLAY THE ACCOUNT MANAGEMENT BAR:
Select: "view" - Then select "Navigator" (Or press Ctrl + N), will display the account management bar as a blue arrow.
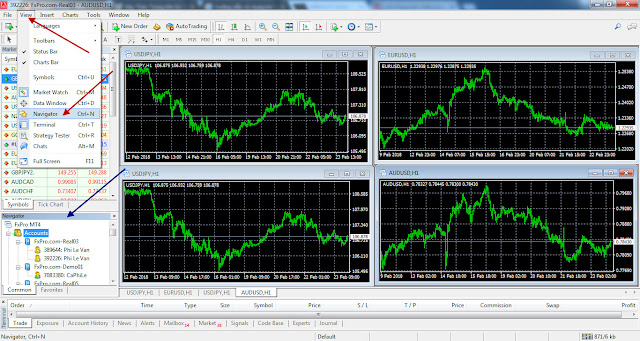
This is the place for you to log in to your trading account (real or demo), or you can switch your login between accounts IN 1 BROKER (for example you have multiple trading accounts of the same broker: Account: accounts use long-term transactions, other accounts use short-term transactions...) by double-clicking on the accounts (after successful first login it will always display a list of accounts logged).
- LOG IN MULTIPLE ACCOUNTS AT DIFFERENT BROKERS ON 1 MT4 SOFTWARE:
Open the account management bar: Ctrl + N
Right click on "Accounts" - Select "Open an Account"
It will display an open an account table with a list of the default broker's servers.
Enter the name of the broker you want to add in the plus sign at the bottom of the list and press "Scan" (eg fxcm, thinkforex, hotforex,...) then select the corresponding server and login with your account.

- ADD OR OFF DISPLAY OF TRADE PRODUCTS:
Once logged in to your trading account, you need to select your trading products, which are currency pairs (forex - for example 28 commonly traded currency pairs), or Gold (Xau/Usd), silver, Bitcoin (BTC) or stocks and stock indices, or oil, coffee,... there are many products you can trade (size and quantity depends on the your broker).
Select "View" - Select "Symbols" (Or press Ctrl + U). Then it will display the list panel, you just need to select your favorite products and press "Show" to show it or press "Hide" to hide it from the list.

- OPEN PRICE CHART FOR TRADE:
There are 2 ways to open a price chart for a trading instrument:
- Method 1: Each product will be a separate tab.
Right click on the product to open - Select "Chart Window"
In this way, it will be displayed like the image below - each product (currency pair, gold, oil, ...) will be in a separate tab. When opened this way, the software will update all the windows you have open at the same time. This method is suitable for observing multiple currency pairs simultaneously, or observing one currency pair on multiple timeframes.

- Method 2: The software only opens 1 chart at any time.
With this way, you only need to close all existing charts, then open any currency pair chart, just select and hold the left mouse button and drag - drop it to the right, if after dropping it, the chart In the form of a small frame, click on the small square icon next to the x on the right corner so that it displays the full screen as the image.

- CUSTOMIZE PRICE CHART:
Once you have logged into your account and have a price chart (for example EUR/USD currency pair as shown in the image), you can start customizing the price chart to suit your habits, preferences, chart types, colors ,... for the convenience of analysis and transactions.

On MetaTrader 4, there are many features, but I only mentioned the basic features for a new person to use. Corresponding to the symbols on the figure, we have the following features:
1: Bar chart.
2: The most popular and optimal chart - Candlestick chart.
3: Line chart.
4: Zoom in on the price chart.
5: Zoom out the price chart.
6: Display price selection is always current. This feature when you need to see the price history in the past, press it off, then press and hold the left mouse button on the chart to drag the price to the past area where you need to see it.
7: Selecting the price will display 1 paragraph from the right edge to make it easier to see when analyzing. This distance can be customized by pressing and dragging the "chart shift" border (the little triangle icon above the price chart). This feature must be used if you trade with the Ichimoku indicator, because Ichimoku needs to show the kumo cloud zone of the future.
A: This is the area for default features, price measurement and comparison, vertical line, horizontal line, sloped line, fibonacci drawing, inserting and marking text on the price chart.
B: Is the area to choose the time frames for the chart, with the symbol M for minutes, H for hours, D for days, W for weeks and MN for months.
- CHANGE COLOR FOR PRICE CHART:
Normally, I always use a price chart with a white background, Candlestick, white candle color for bullish and black candle for bearish, we can easily choose to change the color arbitrarily or change to the default common colors. by:
Right click in the center of the chart - Select "Properties" (Or press F8).

Then display the Properties panel, then select the first Tab "Colors"
Continue to click on the small triangle icon of the "Colors Scheme" section to display 3 common chart colors.
If you choose the white color as I usually use, then select the last line of the "Black On White" list and click OK to complete, immediately the chart will be changed to the color as shown below:

In this section, we can also easily customize the colors as we want by selecting in the rows in the list like the image above.
- ADD / REMOVE 1 TECHNICAL INDICATOR:
There are many technical indicators available on Meta Trader 4 software. To insert any technical indicator into the chart, just do the following:
Select "Insert" - Select "Indicators"
Will display a lot of technical indicators divided into groups such as trends, oscillators, volumes, ... you just need to select the corresponding indicator and it will be added to the price chart. For example you can insert Ichimoku, MACD, SMA, RSI...

To remove an indicator already on the chart just right click on the indicator and select "Delete Indicator".
- DISPLAY SPREAD:
You should display the Spread, to avoid entering the order at a time when the spread is large. To display the spread, right-click anywhere in the list of trading products, and click "Spread".

After the spread is displayed, the right column of the Bid and Ask price columns will be displayed.
Note Spread is displayed as 1/10 of a pip, for example in the green arrow is the USD/JPY currency pair with a spread of 1.9 pips (shown as 19).
- HOW TO ORDER BUY AND SELL TRADE:
To place an order to buy or sell a currency pair (or any other product): Select "Tools" - Select "New Order" (Or press F9)
Then the entry table will be displayed as shown below:

To enter an order AT MARKET PRICE, just select the volume in the Volume box, select the Stop Loss and Take Profit levels and then press the SELL (for sell order) or BUY (for buy order) button.
To enter a Pending Order, just press the F9 key to open the entry table as above, then select the "Type" Item and select "Pending Order".

Then, in the 2nd Type section (below) there are 4 options to enter a pending order including Buy Limit, Sell Limit, Buy Stop and Sell Stop. We just need to select the corresponding order type and then select the order volume in the "Volume" box, select the order execution price in the "At Price" box, set StopLoss and Take Profit and then click "Place".
Best regards,


No comments:
Post a Comment