- Gold price is oscillating in a narrow range around $2,000 ahead of preliminary US S&P PMI data.
- A move beyond the 100.90-102.03 boundary in the USD Index will be considered a decisive move.
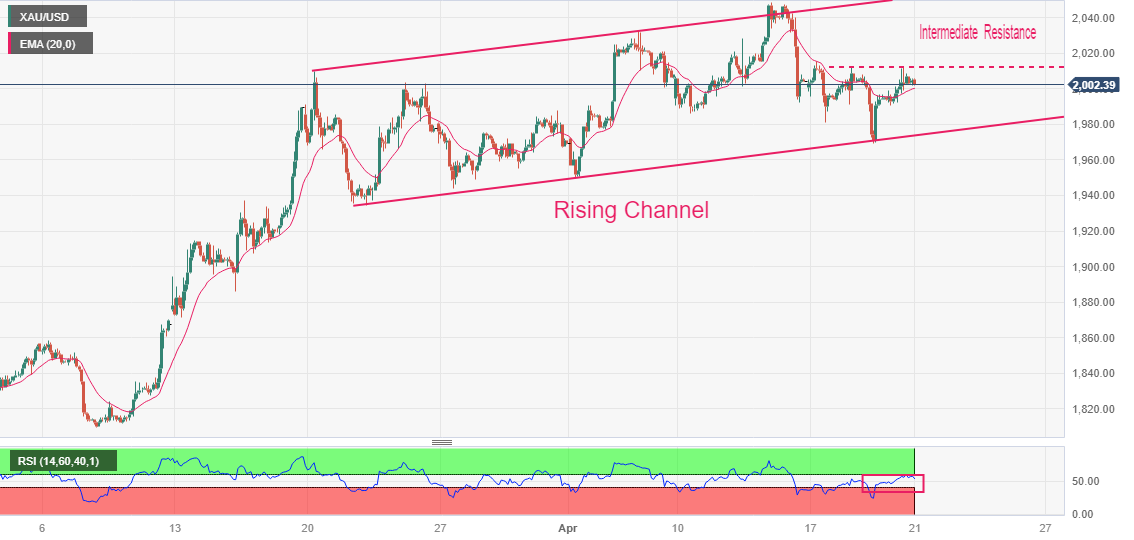
- Gold price is expected to show more upside after breaking above the immediate resistance plotted from $2,011.90.
Gold price (XAU/USD) is displaying a back-and-forth action above the psychological resistance of $2,000.00 in the Asian session. The precious metal has turned sideways to near $2,005.00 after a gradual upside as investors are awaiting the release of the preliminary United States S&P PMI data for fresh impetus.
S&P500 futures have added some gains in the Asian session after three back-to-back bearish settlements. The weak revenue guidance from Tesla due to Elon Musk’s price-cutting spree dented market sentiment. The US Dollar Index (DXY) has extended its correction to near 101.77. The USD Index is inside the woods, consolidating in a range of 100.90-102.03 for the past few trading sessions. Therefore, a move beyond the aforementioned boundary will be considered a decisive move.
The subdued USD index is also weighing on US Treasury yields. The demand for US government bonds has improved amid rising weekly jobless claims. The number of individuals claiming due to unemployment rose to 245K from the consensus of 240K. This signaled a cool-off in the tight labor market and raised hopes of no more rate hikes from the Federal Reserve (Fed) beyond May’s monetary policy meeting.
Going forward, the release of the preliminary US S&P PMI data will dictate the impact on the scale of economic activities due to higher rates from the Fed. As per the estimates, Manufacturing and Services PMI will ease to 49.0 and 51.5 respectively. A weaker-than-projected preliminary PMI data could weigh heavily on the US Dollar.
Gold technical analysis
Gold price showed a stellar recovery after dropping to near the Rising Channel chart pattern formed on a two-hour scale. The precious metal is facing hurdles near the immediate resistance plotted from April 18 high at $2,011.90.
The 20-period Exponential Moving Average (EMA) at $2,000.40 is providing a cushion to the Gold bulls.
Meanwhile, the Relative Strength Index (RSI) (14) is making efforts for overstepping 60.00. An occurrence of the same will activate the bullish momentum.
Gold two-hour chart


No comments:
Post a Comment