Using trend lines is a good choice for technical analysis traders. However, be cautious and do not put all your trust when using it. This article shares 3 notes when using trendlines.
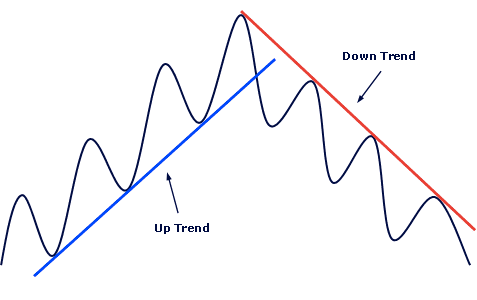
As the image above, the trend line is the straight line connecting the bottoms and the tops. In an uptrend, the trendline connects the bottoms, and in a downtrend it is the line connecting the tops. Trendline is the basis for forming the trend channel. Drawing trend lines and trend channels gives a clearer view of the market and price action. However, when looking for entry and exit points, the trendline has many inaccurate cases, sometimes it is even counterproductive, creating a worse trading result than not using it.
Here are 3 important notes when using trendlines:
1. Usually, a trend line will create a "psychological zone", if it is the convergence point of both "psychological area" and "technical area", the reliability will be greatly increased.

As the image above, in an uptrend, let's say the trendline has been established by the old lows, and is currently continuing as the green line, at points 1 and 2 are just "" psychological zone" (the price is approaching the trendline, so market sentiment will be in favor of buying, expecting the price to rise), and at point 3 is the convergence of both "psychological zone" and "technical area" ( the price has just approached the trend line, and it is the old support level). Thus, when using the trendline, if you only trade with price zones like number 3, the probability of winning is much higher than in price zones 1 and 2.
2. Trendlines do not give us optimal entry points: Because of the first reason, pure forex trading with trendlines (entering at 1 and 2 as shown above) will not give us an entry point. optimal order, for example, the price at 2 has approached the trendline, we enter a BUY order, the price can still continue to decrease to the bottom 1, and then increase, then not optimal entry point will lead to As a result, the R:R ratio (Risk: Profit) will be high (Stop Loss will be longer and Take Profit will be shorter), and trading psychology is also affected (because then the price breaks). trend line leads to panic and not knowing if the uptrend can be changed or not), also every time such a situation occurs our confidence in the trend line will be reduced, leading to It is possible that we lose our temper again or give up on it and look for another tool or indicator.
3. Trend lines can make us wrong about the trend: We should always remember that the trend is determined based on technical areas (tops and bottoms), so there are many cases where the price breaks the line. trend but only reached 50% of the trend reversal condition, but we hastily judge that the trend has changed.
For example the image below:

After the price breaks the trendline, and rises to the bottom of the trendline, a lot of traders think the trend has reversed, and they go short here, and as a result, the price will continue to increase along the blue line. Note that the trend only really changes if the price follows the red line, then the price has established a new lower high and will surely have a new lower low (2 conditions for trend reversal) because the price broke the support area at the black line.
Thank you for reading and sharing this article.
Best regards,


No comments:
Post a Comment